

ESCAPE is happy to see how popular the Radio Galaxy Zoo: LOFAR project is. Since LOFAR's launch two weeks ago, over 234,000 classifications were made! In this brief blogpost we’d like to give an overview about the classification statistics and how the project is coming along. The in-depth scientific results will follow later, after more careful analysis.

In the graph above, you can see the number of classifications per hour. The graph starts at the launch date of the project (25/02) as you can see from the smaller first peak, we started at about 500 classifications an hour. Things really start taking off rapidly around the morning of the next day, as the European press released their articles about the Radio Galaxy Zoo: LOFAR, peaking at 3000 classifications an hour! Afterwards, we see the generally expected day and night trends, following European time, thus indicating most volunteers are European.
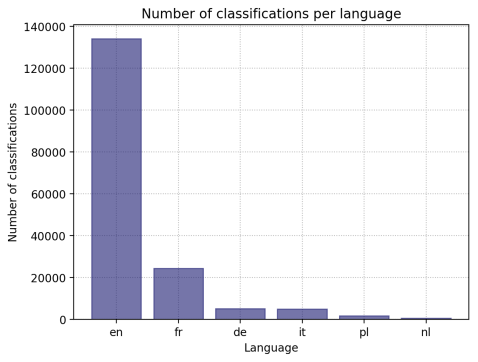
The figure above shows the number of classifications grouped per language setting. As is very clear, English is the dominant one, almost 80% of the classifications are made through the English version of the website. However, French is also a pretty popular langauge setting. This is just a proxy for the distribution of the countries however. It is a bit of a skewed view since there are probably many users that prefer to view the website in English, even when that is not their native language. This is the most likely explanation for the low number of classifications using Dutch language settings. You would expect a lot of classifications with the Dutch settings as the LOFAR telescope itself is located primarily in the Netherlands and therefore has gotten more attention from the Dutch press.

We’d also like to show the distribution of the number of classifications per user. When we zoom out (the right figure) we can see that there are a few users competing hard for the most classifications, right now there is a clear number one at more than 6,000 classifications already, which is amazing.
As of the time of writing this blogpost, we have already found a ton of interesting sources. Many very nice examples of classical double lobes, but also many complex cases and beautiful starforming galaxies have been identified already. As the project has just started, we have not had time to analyze the sources in detail yet, but stay tuned for updates on this!

An interesting thing we noticed was that many people found ‘explosions’ in the Radio Galaxy Zoo: LOFAR, like the one in the image below. Unfortunately, these radial spokes are not an explosion but just imaging artefacts from where our calibration fails, which usually happens around very bright sources. If you see something like this, please click on “Artefact” at the final “Additional information” task.

Additionally, (real) diffuse emission is often mistaken for artefacts, but emission that is not mapping any compact structure is not necessarily an artefact, like the image below:

On the other hand, the small islands of emission in the image below are actually artefacts. Watch out!

Finally, some double lobes were also identified as blends, but this is likely just by volunteers that are still getting the hang of it. See the image below for two example cases that were incorrectly identified as a blend (three and four out of five times respectively). However, these are both just classic double-lobed radio galaxies.

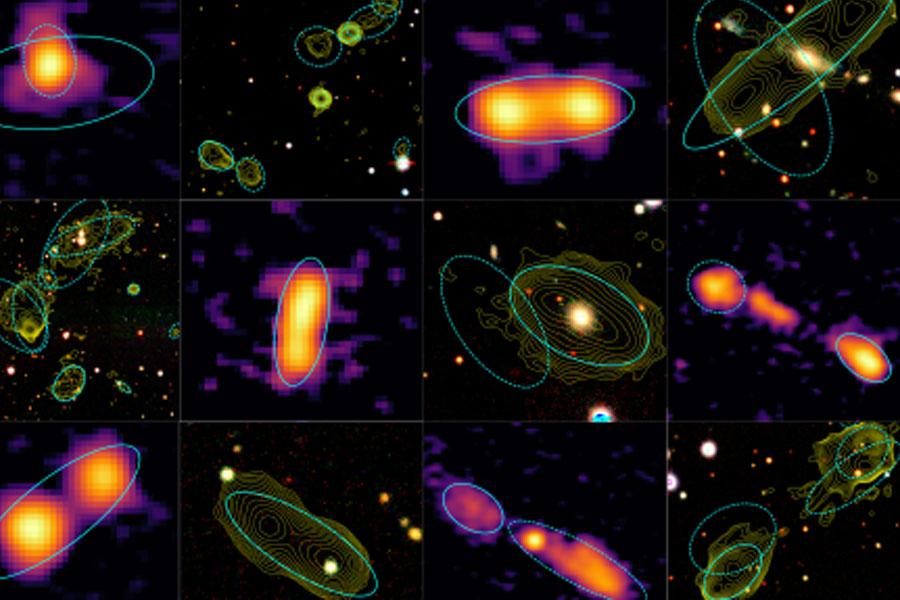
Of course, this is just nitpicking on the cases that are going wrong, but most of the cases seem to be going well. Many real blended sources have also been identified, such as the examples below! So the option “Blend” should be picked when two distinct radio sources are under the solid ellipse.

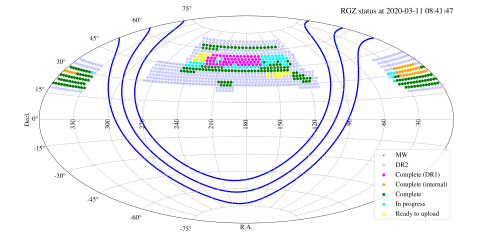
The progress of the first two weeks of the Radio Galaxy Zoo: LOFAR has been amazing. In terms of sky area, the citizen scientists have already seen a quite a big chunk of the northern sky that we want to cover. The image below shows the sky area that we are currently investigating in light blue (called DR2, for data release 2). The purple and orange dots show the fields that the LOFAR team has done internally for the first data release (DR1) and for a small part of the second data release, respectively. The green dots show the fields that the public Radio Galaxy Zoo: LOFAR project has completed thus far.
You can see that in just two weeks we’ve already more than doubled the amount of area that took months for scientists to look at during the first data release of the LOFAR survey! If we keep up the current pace, we will be finished in no time.
As the project continues, we plan to give you more updates on the data reduction process, so stay tuned!
(Blogpost also published Galazy Zoo Blog)